The UK’s off-street parking index
Buying a house can be a daunting task. Many search high and low to find the perfect home that comes with everything they desire, including a suitable place to park their vehicle. The problem is, it can be very expensive, difficult and time consuming to find a house that also comes with off-street parking.
With council restrictions increasing, and insurance providers favouring off-street parking, the demand for this feature has risen in recent years. In fact, around 84% of home buyers state they wouldn't buy a house without a driveway, according to Porcelain Superstore [1]. So to avoid the hassle of tedious searching, we’ve created the off-street parking index to reveal which UK cities have the most affordable houses with off-street parking for the vehicle you select to lease.
Alongside this, we have also spoken to landscaping experts at Marshalls to reveal how much value off-street parking can add to your property and what you should be aware of if you are thinking of converting your land into parking for your vehicle.
Which UK city has the most affordable homes with off-street parking?
At Nationwide Vehicle Contracts, we’ve looked into what areas within the UK are the best places to live if off-street parking is high up on your requirements!
To find the most affordable homes with off-street parking, we analysed the four factors below for the UK’s 40 most populated cities.
- Number of houses for sale in the city
- The percentage of houses for sale with a garage
- The percentage of houses for sale with a driveway
- Average price of a house with off-street parking
Combined and weighted, they produce an overall ‘off-street parking score’ out of 100. So in which UK city came out on top?
Rank | UK City | Population | Number of houses for Sale (March 2022) | % of houses with a garage | % of houses with a driveway | Avg. House price with off-street parking | Off-street parking score /100 |
|---|---|---|---|---|---|---|---|
1 | Warrington | 165,456 | 276 | 46% | 58% | £161,604 | 89 |
2 | Dudley | 199,059 | 122 | 50% | 60% | £213,000 | 88 |
3 | Mansfield | 171,958 | 168 | 57% | 64% | £268,189 | 87 |
4 | Newcastle upon Tyne | 192,382 | 380 | 52% | 47% | £206,187 | 83 |
5 | Preston | 313,332 | 527 | 48% | 50% | £223,325 | 81 |
6 | Derby | 270,468 | 244 | 48% | 53% | £266,719 | 77 |
7 | Wigan | 173,314 | 133 | 39% | 55% | £193,500 | 76 |
8 | Peterborough | 163,379 | 375 | 55% | 49% | £314,699 | 72 |
9 | Nottingham | 729,977 | 1,219 | 45% | 54% | £307,820 | 70 |
10 | Stoke-on-Trent | 372,775 | 420 | 32% | 43% | £167,121 | 64 |
11 | Sunderland | 335,415 | 244 | 44% | 36% | £171,524 | 63 |
12 | Glasgow | 591,620 | 314 | 30% | 46% | £187,357 | 61 |
13 | Southend-on-Sea | 295,310 | 127 | 49% | 49% | £482,857 | 60 |
14 | Milton Keynes | 229,941 | 328 | 54% | 42% | £405,672 | 59 |
15 | Norwich | 213,166 | 342 | 44% | 44% | £299,431 | 59 |
16 | Leeds | 455,123 | 959 | 44% | 45% | £324,363 | 58 |
17 | Swansea | 300,352 | 439 | 38% | 41% | £272,833 | 56 |
18 | Wolverhampton | 252,791 | 254 | 33% | 40% | £214,205 | 56 |
19 | Crawley | 180,508 | 127 | 45% | 47% | £387,748 | 56 |
20 | Ipswich | 178,835 | 144 | 37% | 39% | £263,614 | 55 |
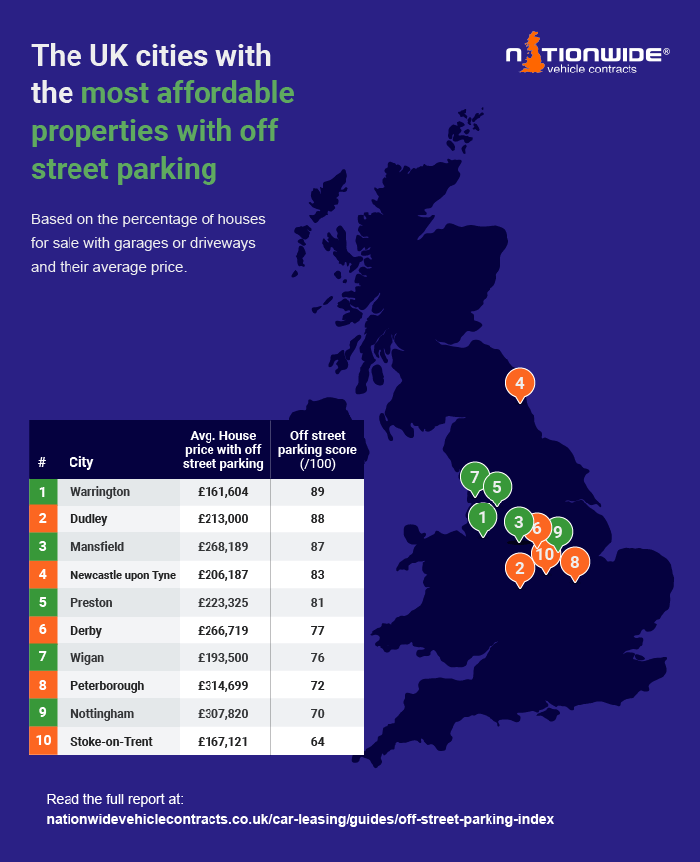
We found the most affordable town for homes with off-street parking was Warrington in Cheshire. This large town is the best place to find your dream home where you can park your vehicle safely in a driveway or garage. The average house price in Warrington is £161,604 with off-street parking. Out of the 276 houses for sale, 46% come with a garage and 58% with a driveway. With a population of 165,456, you will need to act fast to secure your dream home with off-street parking in this town.
Warrington scored an overall index of 89 out of 100 based on these factors, proving this popular town has a range of affordable homes, where you can park your car safely and off the road.
Dudley is the second most affordable town with off-street parking
Coming in second place in our index in the UK was Dudley, with an impressive score of 88 out of 100. With the population at 199,059 in this town, means it is all the more competitive to find your perfect home. However the good news for all residents, is they live in an affordable area for homes that come with off-street parking.
Out of the homes for sale in this area, 50% come with garages and 60% with driveways. If that wasn't captivating enough, Dudley also offers the average house price at only £213,000 with off-street parking. This is a great opportunity to buy a house where you can park your car off the road, without breaking your budget.
Mansfield ranks third with the most houses that come with garages and driveways
Our research reveals Mansfield has the most homes with garages and driveways in the UK out of all cities analysed, which is a great advantage for the town's 171,958 population. With the average house price being £268,189, the most expensive out of the top 3, 57% come with a garage and 64% with a driveway. So even though the house price is high, it might be worth spending that extra amount to ensure your vehicle has secure off-street parking.
Altogether this popular town scored 87 out of 100 in our index, so it might be worth starting your search in this area to ensure you get your dream house with the bonus of a garage or driveway for your car.
Which London borough has the most affordable homes with off-street parking?
It comes as no surprise that London did not feature within our top 20. However, using the same metrics we took a deeper look into the capital to see which boroughs offer the most affordable houses with off-street parking.

Rank | London Borough | Number of houses for Sale (March 2022) | % of houses with a garage | % of houses with a driveway | Avg. House price with off-street parking | Off-street parking score /100 | |
|---|---|---|---|---|---|---|---|
1 | Havering | Outer London | 742 | 28% | 20% | £555,588 | 93 |
2 | Bexley | Outer London | 480 | 28% | 14% | £540,807 | 91 |
3 | Bromley | Outer London | 1,023 | 29% | 17% | £603,902 | 90 |
4 | Sutton | Outer London | 584 | 21% | 11% | £488,485 | 88 |
5 | Redbridge | Outer London | 760 | 21% | 13% | £584,461 | 82 |
London is quite tight on space but the borough most likely to get a garage or driveway in outer London is Havering. This borough, located in east London, is home to some expensive houses with off-street parking, with the average house price being £555,588. The price shouldn't come as a surprise considering its location, but in Havering you're looking at 28% of houses coming with a garage and 20% with a driveway.
Bexley ranked second with only 480 houses for sale compared to Havering, but the average house price with off-street parking is cheaper at £540,807. So it might be worth looking in this borough to save some money. Bromley has the highest average house price in the top five and ranked in third, however, this London borough has the highest percentage of houses with a garage at 29% which we think is worth the price increase.
The top 5 inner London boroughs that have the most affordable houses with off-street parking:
Rank | London Borough | Number of houses for Sale (March 2022) | % of houses with a garage | % of houses with a driveway | Avg. House price with off-street parking | Off-street parking score /100 | |
|---|---|---|---|---|---|---|---|
1 | Lewisham | Inner London | 1,510 | 6% | 4% | £619,102 | 53 |
2 | Newham | Inner London | 1,442 | 2% | 1% | £547,750 | 42 |
3 | Lambeth | Inner London | 2,529 | 3% | 1% | £740,985 | 35 |
4 | City of London | Inner London | 342 | 0% | 12% | £2,233,250 | 30 |
5 | Wandsworth | Inner London | 3,207 | 4% | 1% | £1,249,993 | 29 |
Looking more central, the inner London borough most likely to get off-street parking, is Lewisham. The percentage of houses that come with a garage or driveway is much lower than outer London, which is understandable with all that is on your doorstep. Lewisham still has 6% of houses with a garage and 4% with a driveway - proving to be the best place to buy in inner London if you want off-street parking, as well as all the fun London has to offer. The average house price in this borough is £619.102, if you're lucky enough to get a house with a garage or driveway in the capital!
Inner London has a number of houses for sale, with 1,442 available in Newham, ranking in second overall and 2,529 in Lambeth coming in third. Both boroughs have a number of houses available but only 3% or under come with off-street parking. So make sure you act fast if you find a house you like, as it will be very competitive to find one with off-street parking for your vehicle.
How much does a driveway renovation cost?
A driveway is a big part of your home and keeps your vehicles safe. It is the first thing people see when visiting, and the first thing you come home to. Whether you're thinking of building a brand new driveway or updating your existing drive, we have got you covered!
The cost of a driveway renovation depends strongly on the location, size, material and labour you use. However, to give you a guide on the costs, we analysed the price of different driveway surfaces[2] across a variety of sizes.
Average size of one standard parking space | Budget driveway | Standard driveway | Luxury driveway | ||
|---|---|---|---|---|---|
Driveway Material | Average cost per m2* | 15m2 | 30m2 | 60m2 | 90m2 |
Tarmac | £70 | £1,050 | £2,100 | £4,200 | £6,300 |
Block Paving | £90 | £1,350 | £2,700 | £5,400 | £8,100 |
Resin bound | £100 | £1,500 | £3,000 | £6,000 | £9,000 |
Concrete | £20 | £300 | £600 | £1,200 | £1,800 |
Gravel | £40 | £600 | £1,200 | £2,400 | £3,600 |
*source: Checkatrade and Marshalls
Resin bound is the most expensive material to use for your driveway renovation. At £100 per m², it would cost up to £9,000 to build a luxury driveway for multiple vehicles. On the other end of the spectrum is concrete which can cost as little as £21.35 per m² according to Marshalls, making it an affordable yet longer-lasting option. For other materials, like tarmac or block paving, you should look to budget of around £70-£90 per m².
Porcelain paving is now an option for driveways too. Loved for gardens because of its modern look and low maintenance properties, suppliers are increasingly offering heavy-duty versions that are suitable for vehicles to drive and park on.
On top of material costs, it's likely you will also need additional funding for features such as ground and drainage work, gates and lighting, and not to forget dropping off the kerb which on its own can cost anywhere from £300 to £600 with planning permission.
How much value does off-street parking add to a property?
Parking as a whole is an issue in many places across the UK, especially in busy cities, so it's only natural for home buyers to want off-street parking for their car. Also, given that the vast majority of cars spend most of the time stationary, off-street parking is a big desire when buying a house for safety and a peace of mind.
That said, how much value does off-street parking add to a property?
After looking into the sale price of properties with parking, it’s estimated that laying a driveway can add up to 10% to the value of a property[3]. Not only is it great to have somewhere to park your car safely off the road, but it can also make your driveway attractive - complimenting your home and making it easier to sell.
With the average price of a house being £274,000 in the UK, a 5-10% increase in value from adding a driveway could leave you with a profit of anywhere from £4,700 to £26,800 depending on the type and size of driveway you go for. You could be looking at even more profit if the property is in an urban area, where parking is a premium feature!
A driveway’s potential return on investment:
Budget driveway | Standard driveway | Luxury driveway | |
|---|---|---|---|
ONS average UK house price (Jan 2022) | Estimated profit of a £600 driveway | Estimated profit of a £3,700 driveway | Estimated profit of a £9,000 driveway |
£274,000 | £13,100 - £26,800 | £10,000 - £23,700 | £4,700 - £18,400 |
*A driveway can add between 5-10% to the value of a property - Source: Checkatrade | Virgin Money | YourParkingSpace
However, not all driveways can add value to your home. If you do not have a dropped kerb that is approved by authorities you will not actually be able to use your driveway as it is illegal to drive over a public pavement. Also, if your driveway is in a poor condition and has issues with drainage, leading to flooding risks, this could devalue your home as it will put potential buyers off making your home harder to sell.
It's also worth noting some housebuilders could face a paved driveway ban due to new restrictions on river pollution. With the help to clean up the UK’s waterways, the government is looking at new driveway rules. Currently, paved driveways don't allow water to soak into the ground, causing excess water that could leak into rivers. So when converting your garden into off-street parking, you might need to show the plans for a sustainable drainage system in place. Additionally, to favour green spaces, the new rules may include limitations on solid paved driveways.
How to convert your garden into off-road parking and what to be aware of
While the excitement of transforming your garden into off-road parking can take over your mind, it’s also important to think about what to be aware of ahead of time to make sure you don't break any laws in the process.
To help with all to do’s and don’ts while planning your refurbishment, landscaping experts at Marshalls have provided their professional advice on how to convert your front garden into a driveway.
Anna Hampshire, Head of Marketing at Marshalls commented on three main things to consider:
Key decisions
“When creating a driveway, there are two main considerations; first of all, the style you are aiming for but, equally as important, consider the practicality of what you are planning to use your new drive for. Growing families need to maximise the space for cars, whereas those who may be looking to sell in the near future need to consider kerb appeal; removing tired old tarmac and replacing it with new block paving can add more value than you think.”
Design and layout
“There is no set minimum width for a drive, it is the design you choose that is practical for the type and number of vehicles that are going to be using it. Take into account if you have several vehicles next to each other, it is no good measuring the width of your vehicles then finding you have to step out onto muddy grass. Ensure your design gives you easy access from the highway to your driveway, remember it is an offence to reverse onto a public highway from your driveway so in designing your drive make sure the drive is wide enough to accommodate reversing into your drive from the highway which is perfectly legal. If you have room for a turning circle or small reversing bay then build it into your design as it makes life much easier.”
Sustainability and legislation
“Driveway legislation are there to reduce the impact of flooding. Put simply, any new driveway over 5m2 needs to have a drainage system for the water to run to a permeable area. If it doesn’t, then you will need to get planning permission. Permeable paving gives you the option of not having to apply for planning permission to have your driveway completed, many of the best quality ranges enable the water to drain straight back into the ground through your paving and sub base. An alternative approach is to direct rainwater to runoff from hard paving into soft planted areas, where it can soak naturally into the ground. To achieve this, you need to build a gentle slope on the driveway in the direction the water needs to flow, making sure that the slope falls away from the public pavement or highway.”
How can you make money from renting out your driveway?
Driveways and garages can not only add value to your property but can also be used to generate some cash by renting out your space. This is especially worth knowing if you live near a sports stadium, an airport, or a train station where parking is limited and expensive. On average, renting out your space could help you earn up to £200 a month (and even more in places such as London).
Despite this, it's estimated that over half of the UK’s garages are not actually used to park a vehicle in, and are instead used as home storage[4]. That works out as over 5.7 million garages not being used for their original purpose, which accounts for over £1.4 billion of wasted potential income a month.
The UK’s off-street parking
If you're in the process of building a driveway or have your eyes on an upcoming home with off-street parking, but don’t have a car sorted yet, we have some great car leasing deals available on all types of models. Show off your new car in style with Nationwide Vehicle Contracts.
Methodology
Using a list of the 40 most populated UK cities and all London boroughs, Nationwide Vehicle Contracts analysed Zoopla’s real estate data to reveal the percentage of properties for sale in each area with off-street driveways or garages. These properties were then further analysed to work out the average advertised sale price for a property with off-street parking.
Locations were then scored on the percentage of properties with garages and driveways and their average price to reveal the areas with the most affordable properties with off-street parking.
Data collected March 2022.
Sources
[1] “Homebuyer Habits: What makes you buy a house?” (Porcelain Superstore)
[2] “How much does it cost to resurface a driveway?” (Checkatrade)
[3] “Just how much value does a driveway really add to your home?” (Leaders, 2019)
[4] “Nearly six million UK garages not used for cars as they’re too full of junk” (RAC, 2021)
Guide Information
Originally published: 29th April 2022
Last updated: 13th May 2022