UK Road Safety Report
Safest Times, Locations and Conditions for UK Drivers, Revealed
In 2022, there are more used and new cars on UK roads than ever before. In fact, more than 400,000 practical driving tests took place between October and December 2021 - that’s around 4,300 tests per day! This means more cars and drivers on the roads, which can only increase the risk of having an accident.
But did you know you might be more likely to have a crash depending on where you live and the time of day you drive, too? While collisions and crashes aren’t an absolute certainty, the risk is always there.
Below, we’ve collated all the essential data to give you as much information as we can about crashes that occurred between 2013 and 2020 in the UK.
The most dangerous areas to drive in the UK
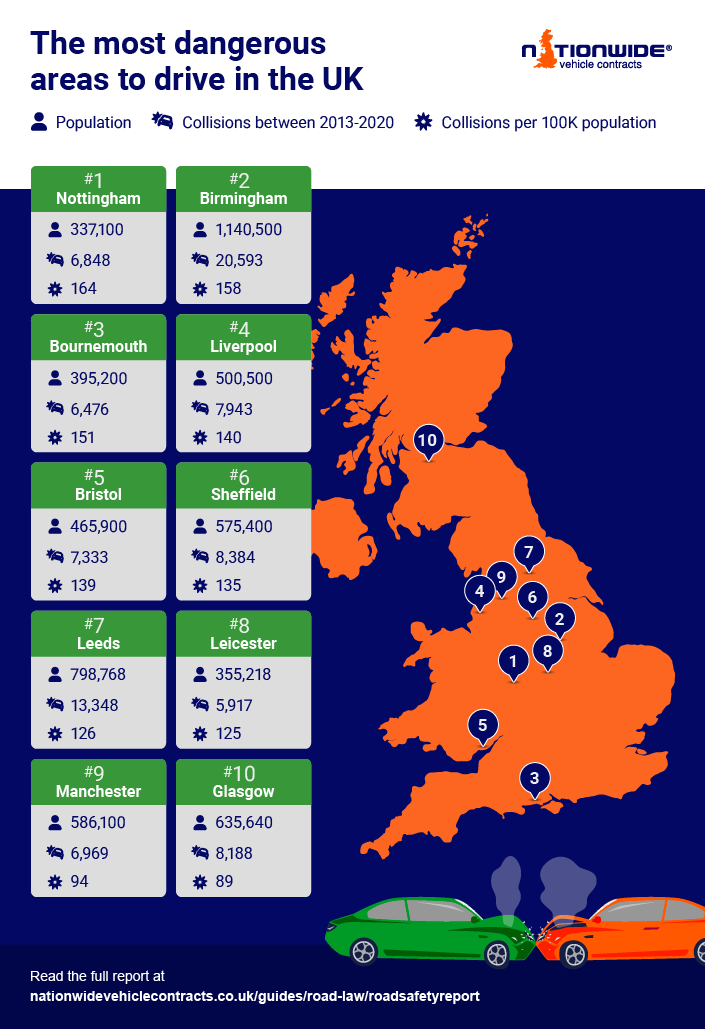
When it comes to the number of collisions in the UK and their locations, Nottingham experienced the most crashes by population, with 164 collisions per 100k people. Birmingham came in second with 158 collisions per 100k.
The top 10 areas with the highest amount of collisions
City | Total collisions 2013-2020 | Population |
|---|---|---|
Nottingham | 6,848 | 337,100 |
Birmingham | 20,593 | 1,140,500 |
Bournemouth, Christchurch and Poole | 6,476 | 395,200 |
Liverpool | 7,943 | 500,500 |
City of Bristol | 7,333 | 465,900 |
Sheffield | 8,384 | 575,400 |
Leeds | 13,348 | 798,768 |
Leicester | 5,917 | 355,218 |
Manchester | 6,969 | 586,100 |
City of Glasgow | 8,188 | 635,640 |
At the end of the table, Leicester, Manchester and Glasgow had the fewest number of collisions at just 124.5, 94 and 89.25 crashes per 100k people, which seems surprising as these are still quite big cities with populations of more than 350,000. In fact the population of both Manchester and Glasgow sit at more than 580,000.
The most dangerous days to drive
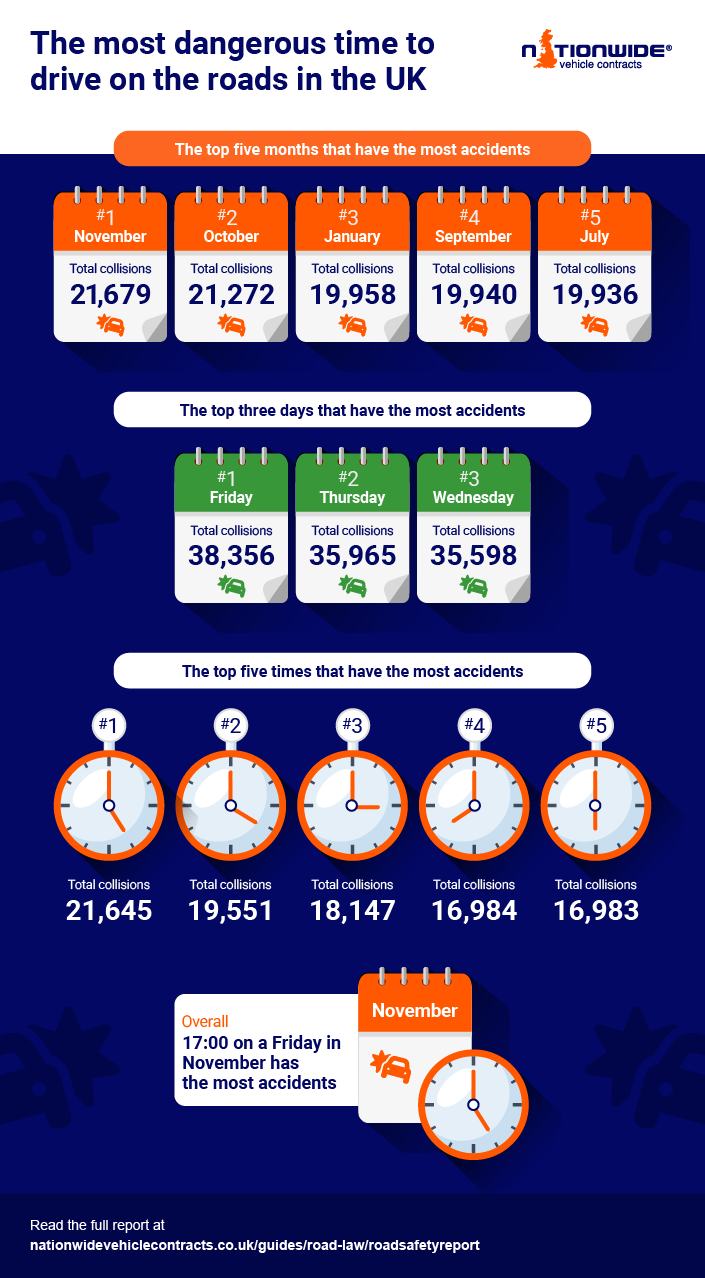
Should you want to avoid having an accident, you might be interested to know the days, months and times that crashes are most likely to occur. Our data found that Fridays, in November, at 5pm was the riskiest time to drive, as there were a total of 21,645 collisions in the UK during this time.
Fridays are generally the day when more crashes occur too, with a total of 38,000 crashes happening on this day between 2013 and 2020. This might be due to people coming home from work, but it could also be that there are more drivers travelling ahead of the weekend.
The top 5 worst ages for casualties
Casualty age | Casualty number | Slightly injured | Seriously injured | Killed |
|---|---|---|---|---|
10-16 | 21,168 | 2,363 | 3,345 | 71 |
17-23 | 55,031 | 2,446 | 7,525 | 406 |
24-30 | 53,171 | 2,456 | 6,450 | 391 |
31-37 | 40,609 | 2,446 | 1,831 | 235 |
38-44 | 33,876 | 2,083 | 1,463 | 179 |
Age is always an interesting factor to look at, particularly as car insurance is heavily weighted by age (younger drivers are thought to be more risky to insure).
When looking at the data, it does seem that this is the case, as the highest number of casualties related to people between the ages of 17 and 23. Our data shows that 20-year-olds are most likely to have an accident, with around 8,697 collisions occurring during the seven-year period.
The figures consistently drop from around age 26 onwards, decreasing to around 4,000 accidents for those in their 40s, 3,000 for age 50s and 1,000 for age 60s. Interestingly, the elderly have one of the lowest risks of crashing with only 250 incidents involving 90-year-olds.
You’ll be pleased to know that the majority of crashes in the UK are only of slight severity. In fact, 83% were slightly severe and 16% were serious. Only 1% of crashes were fatal.
Types of people and vehicles involved in accidents
1. Birmingham | 2. Cambridgeshire | 3. Sheffield | 4. Northamptonshire | 5. Oxfordshire | |
|---|---|---|---|---|---|
Pedestrians | 1,262* | 252 | 534 | 390 | 292 |
Cars | 999 | 1,017 | 703 | 991 | 873 |
Motorbikes | 527 | 435 | 260 | 447 | 497 |
Pedal bikes | 380 | 516 | 287 | 248 | 450 |
Bus | 14 | 39 | 41 | 26 | 19 |
6. Gloucestershire | 7. Leeds | 8. Liverpool | 9. City of Glasgow | 10. Bradford | |
|---|---|---|---|---|---|
Pedestrians | 322 | 671 | 646 | 648 | 516 |
Cars | 828 | 704 | 350 | 307 | 416 |
Motorbikes | 402 | 480 | 248 | 118 | 216 |
Pedal bikes | 268 | 447 | 298 | 200 | 182 |
Bus | 9 | 47 | 21 | 30 | 21 |
*No. of casualties
When it comes to the types of people and vehicles involved in accidents, pedestrians were more likely to be involved in an accident in Birmingham, as were motorbikes. For cars, the biggest number of accidents occurred across Northamptonshire, Oxfordshire and Cambridgeshire (excluding Peterborough). Buses were significantly less likely to crash and had fewer casualties. The safest place to take a bus was Gloucestershire, and the most casualties from bus accidents occured in Leeds.
Crashes that happen in different conditions
Collisions in dry conditions | Collisions in the wet/damp | Collisions in the daylight | Collisions in the dark |
|---|---|---|---|
167,625 | 60,267 | 165,900 | 61,773 |
The conditions that we drive in can have a big impact on the likelihood of an accident too. But somewhat surprisingly, most accidents happen on dry roads during the day, as opposed to wet roads at night.
In dry conditions, there were a total of 167,000 accidents and in wet or damp, only around 60,000. In daylight, there were around 165,000 collisions and 61,000 in darkness. Fewer than 1,000 crashes occurred in the snow, which could suggest drivers are more careful in tricky driving conditions.
What to do if you're involved in an accident
If you’re ever involved in an accident, the best thing to do is remain calm. Stop the car, turn off the engine and switch on the hazard warning lights. You or someone else may need to call an ambulance or the police. Once you feel able, you should also speak to your insurance provider to make a claim.
Further reading around road safety
For more information and advice about topics related to road safety, please view these guides:
Best First Cars for New & Young Drivers
UK Car Insurance Groups Explained
What happens if my leased vehicle is involved in an accident?
Nationwide Vehicle Contracts is one of the UK’s leading providers of car leasing. Get in touch to find out more about leasing a car or enquire about one of our models today.
Guide Information
Originally published: 31st October 2022
Last updated: 4th August 2022